
Sunday, 3 September 2006
Wednesday, 30 August 2006
Looking back at the hot stocks
When will ERS, TIE, HANS, ISRG and NTRI stop going up. During the summer, when the bears come for lunch and the hedgies pull their money out of the speculative stocks and into oil and big caps, that's when. What's happening now? Oil money's going to tech, and metal stocks are flat-lining. The next week should tell us where things are headed for sure. Q's are getting ready to break 39, and then we are going to rip to the upside. I would be long SMH and short XLE even though we have hurricane threats.
Sunday, 13 August 2006
Thursday, 10 August 2006
Time to learn
Starting tommorow I'm going to record my charts that I'm watching and also my TWS quotes where I place trades while recording. I'm going to give a reason for the trade entry with a profit target and a stop loss. I will be trading futures, oil sector, and volatile stocks. This is so that I can go back and review my trades in real time and figure out what I'm doing right and wrong.
Strategies on Oil stocks
When the oil numbers come out, you want to be on the same side of XLE or similiar sector stocks 30min later. Some good volatile stocks this works on is DVN and APC. The last couple of times the numbers came out we chopped around for 30min, and then broke out and trended up all day. So keep a note when the numbers are due. You want to be on the same side of the trade 30min after the announcement for a high probability of good trending action.
Monday, 10 July 2006
More strategies
I need to test new strategies. I need to also review pair trades. Overall, after watching the market for the last month, I think it all comes down to watching the active sectors for the day, watching the futures, using S/R lines, trend lines, and evaluating trade entries based on high probabilities. The initial entry may not be perfect, probably will rarely be spot on, but define your risk, and give yourself time for your target to be hit with a trailing stop that won't get hit off of 1 or 2 ticks.
I would like another monitor so I could watch 80 stocks. Right now I watch around 25 charts. I would like to have charts for all the sectors and the major stocks in the sector. I would like a porfolio with a list of all the stocks in that sector so I can pick who is the leader and laggard. I would like a porfolio of all the volatile stocks as well. Also I should make a porfolio each day of my scans of hot stocks that meet my criteria, whether it be new highs/lows, % gainers/losers, or large intraday range and volume.
I would like another monitor so I could watch 80 stocks. Right now I watch around 25 charts. I would like to have charts for all the sectors and the major stocks in the sector. I would like a porfolio with a list of all the stocks in that sector so I can pick who is the leader and laggard. I would like a porfolio of all the volatile stocks as well. Also I should make a porfolio each day of my scans of hot stocks that meet my criteria, whether it be new highs/lows, % gainers/losers, or large intraday range and volume.
Tuesday, 13 June 2006
New correlation stuff
I found another website where you can run correlation between stocks and ETF's at www.spdrindex.com/correlation. I need to focus more on leading sectors as my leading indicators. I think I'm going to start using Ben the S&P broadcaster to help with my trading. I'm going to see which index is leading and lagging. I believe the Nasdaq has been the leading indicator to where things are headed. The Techs haven't been getting beaten as badly as the other sectors probably because they are already beat down pretty hard. I notice that there was good volume on the moves to the upside today when looking at the indices. Also, the VIX is at 23.81. Great volatility for day trading. I just need to practice and get better. I'm looking at the VIX and it is the smoothest looking chart I've ever seen, with nothing but trianliar patterns.

The question is when this trend line will break. Stocks like TIE and HANS are getting beat down hard, rightfully so. Just when you want to buy something that seems like it will keep going up forever it normally is at a peak and you can suffer some serious loses if you don't use stops.
The VIX today ended up 13.6% at 23.81. The long term trend line on the VIX has been broken. We are in BEAR COUNTRY!

VIX to $30?

The question is when this trend line will break. Stocks like TIE and HANS are getting beat down hard, rightfully so. Just when you want to buy something that seems like it will keep going up forever it normally is at a peak and you can suffer some serious loses if you don't use stops.
The VIX today ended up 13.6% at 23.81. The long term trend line on the VIX has been broken. We are in BEAR COUNTRY!
VIX to $30?
Friday, 9 June 2006
An intraday variation to Pairs trading, my style of trading
It took me a while to find a strategy that worked intraday that would give me signals for high probability trades to occur. I use to try to trade stocks which had very little correlation with each other, and I use to only watch a couple charts,,,that was a waste of time, however I learned chart patterns and high probability setups.
To know how to trade, you must know how the market is connected. I suggest looking at the market from a top down approach and then narrow it down to a few products to trade.
1.You must realize that the futures like the ES,YM, and NQ are your greatest indicators intraday. (you may also may take note of the EURO and Bonds,,however,,these often react to whatever the futures are doing)
2.The TICK and TRIN are your second greatest indicators
3.The index in which the stock you are trading is third most important (and you will want to find an index which has high volume and has a high correlation with the futures,,things llike XLF,XLE,SMH, are good choices for their volume, obviously SMH is better if your watching NQ, and XLF or XLE would be better for ES/YM)
4.In the index you are watching, there may be sub-sectors,,and in these sub sectors you may find stocks even more correlated. For example you may like the financial sector; XLF. If you choose this sector, analyze to see which stocks are most correlated, and which stock often acts as a leader in the moves and which is slow and catches up.
To see what I mean look at this:

5.Now that you have your basket of stocks that you watch everyday, you will watch to see which stock makes the first move in a particular direction, and then you will decide what stock from your basket is most likely to catch up. You do not short the leading stock, that would be stupid, because it will continue in its direction and it's advancement may grow stronger as the sector grows stronger from all of the other stocks catching up. Obviously, your sector is most likely going to move becuase of what the futures are doing.
6.To be good at stocks, it really helps to know how futures trade and how to trade using the TICKS. When trading with the TICK, you look for a higher high or lower low then the previous TICK, and also you need to take note of apparent trend lines on the TICK chart, which when broken, will cause a reaction in the futures, which causes a reaction in your sector and a reaction in its underlying stocks.
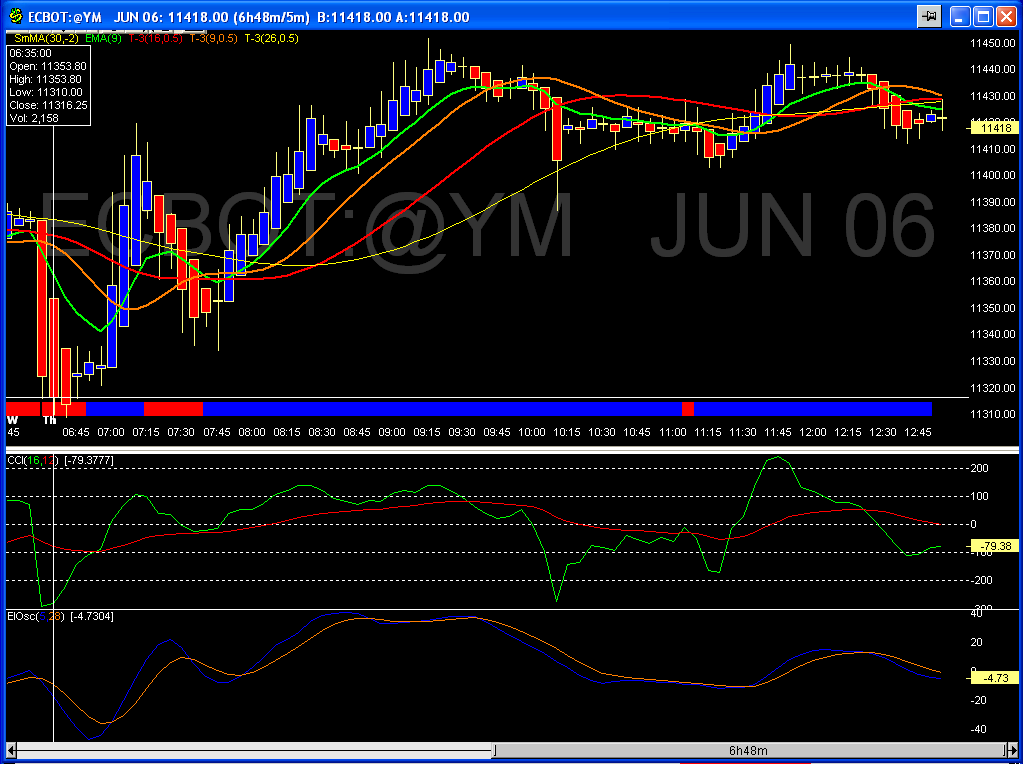
I probably watch 15-20 charts during the day. I personally use 1min charts(sometimes 12 sec charts) for trading and when I see a trade setup I just turn my eyes to the bid/ask spread and look for the best entry, I trade the YM and a basket of stocks at the same time, first taking an entry on the YM and then getting into stocks. If I was correct on the YM trade, then my trade on the stocks will pay off too. Most of my trades are in the black within 20 seconds, however, sometimes the ticks may give a fake out and I may have to add to the position before the ticks break the trend line and start moving my trade into the correct direction. I look for an exit on the YM at tick extremes most of the time, unless I'm going to hold the position longer. The exit on the stocks will be after the exit on the YM because the stocks are slower to catch up. Also, it is in your best interest to trade in the direction of the moving average. If you miss a reversal, it is very likely that the trend will continue and you can enter on the next bullish/bearish candlestick harami. However, the point to this style of trading is to notice the reversal in a leading stock, and get into the slow stock before it is bid up or down. While the leading stock may start rolling over along with the ticks and YM, my lagging stock may be at its high, which is perfect for a short entry.
So, when your trading, I would suggest you use a futures contract, the tick, trin, a sector, and a basket of highly correlated stocks. With my strategy, you trade only one direction, which is the direction of the futures, and there is no short the leader and buy the laggard like how Pair trading is based. The ORIGINAL pair strategy works best between different sectors, not between two stocks in the same sector. Also the pair strategy works best on a much larger time frame then intraday if you were to actually try to trade a real "market neutral trade", for example:
This is a classic example of what a pair trade should look like between anti-correlated sectors, you would want to be using options that have many months of time decay so less capital is tied up.

To know how to trade, you must know how the market is connected. I suggest looking at the market from a top down approach and then narrow it down to a few products to trade.
1.You must realize that the futures like the ES,YM, and NQ are your greatest indicators intraday. (you may also may take note of the EURO and Bonds,,however,,these often react to whatever the futures are doing)
2.The TICK and TRIN are your second greatest indicators
3.The index in which the stock you are trading is third most important (and you will want to find an index which has high volume and has a high correlation with the futures,,things llike XLF,XLE,SMH, are good choices for their volume, obviously SMH is better if your watching NQ, and XLF or XLE would be better for ES/YM)
4.In the index you are watching, there may be sub-sectors,,and in these sub sectors you may find stocks even more correlated. For example you may like the financial sector; XLF. If you choose this sector, analyze to see which stocks are most correlated, and which stock often acts as a leader in the moves and which is slow and catches up.
To see what I mean look at this:
5.Now that you have your basket of stocks that you watch everyday, you will watch to see which stock makes the first move in a particular direction, and then you will decide what stock from your basket is most likely to catch up. You do not short the leading stock, that would be stupid, because it will continue in its direction and it's advancement may grow stronger as the sector grows stronger from all of the other stocks catching up. Obviously, your sector is most likely going to move becuase of what the futures are doing.
6.To be good at stocks, it really helps to know how futures trade and how to trade using the TICKS. When trading with the TICK, you look for a higher high or lower low then the previous TICK, and also you need to take note of apparent trend lines on the TICK chart, which when broken, will cause a reaction in the futures, which causes a reaction in your sector and a reaction in its underlying stocks.
I probably watch 15-20 charts during the day. I personally use 1min charts(sometimes 12 sec charts) for trading and when I see a trade setup I just turn my eyes to the bid/ask spread and look for the best entry, I trade the YM and a basket of stocks at the same time, first taking an entry on the YM and then getting into stocks. If I was correct on the YM trade, then my trade on the stocks will pay off too. Most of my trades are in the black within 20 seconds, however, sometimes the ticks may give a fake out and I may have to add to the position before the ticks break the trend line and start moving my trade into the correct direction. I look for an exit on the YM at tick extremes most of the time, unless I'm going to hold the position longer. The exit on the stocks will be after the exit on the YM because the stocks are slower to catch up. Also, it is in your best interest to trade in the direction of the moving average. If you miss a reversal, it is very likely that the trend will continue and you can enter on the next bullish/bearish candlestick harami. However, the point to this style of trading is to notice the reversal in a leading stock, and get into the slow stock before it is bid up or down. While the leading stock may start rolling over along with the ticks and YM, my lagging stock may be at its high, which is perfect for a short entry.
So, when your trading, I would suggest you use a futures contract, the tick, trin, a sector, and a basket of highly correlated stocks. With my strategy, you trade only one direction, which is the direction of the futures, and there is no short the leader and buy the laggard like how Pair trading is based. The ORIGINAL pair strategy works best between different sectors, not between two stocks in the same sector. Also the pair strategy works best on a much larger time frame then intraday if you were to actually try to trade a real "market neutral trade", for example:
This is a classic example of what a pair trade should look like between anti-correlated sectors, you would want to be using options that have many months of time decay so less capital is tied up.
Tuesday, 6 June 2006
Pairs- Market Topology
Pairs trading works like this. You have 2 highly correlated pairs in which you want to follow. It doesn't matter which stocks moves first in a particular direction, the key is to get into the laggard stock which will eventually catch up to the leader. Also, you have anti-correlated pairs, in which case you want to short when your stock goes up and vice versa. Here is a great example of 2 pairs(CHK and ECA) and it has 2 corresponding anti-correlated pairs(AMR and CAL).

Here's a Pair:

Depending on what type of trader you are, this strategy can be used for swing and day trading. Also, a good website to use to find pairs and anti-correlated pairs is www.market-topology.com.
Here's a Pair:
Depending on what type of trader you are, this strategy can be used for swing and day trading. Also, a good website to use to find pairs and anti-correlated pairs is www.market-topology.com.
Thursday, 1 June 2006
ARB'ing OIH.
It's working, but I still need to practice my exits and work on hot key stops. Also, I need to have IB on speed dial incase the cable goes out, which has happened in the past. Maybe I'll use market orders with far out stops incase the internet connection goes down, that way I will be protected somewhat, even though I would prefer to close the posistions as soon as the internet connection goes down.
I'm watch the highest weighted stocks in OIH and the volume leaders for arbing opportunities.
I'm watch the highest weighted stocks in OIH and the volume leaders for arbing opportunities.
Wednesday, 31 May 2006
A TRADING STRATEGY
I have found a way to consistently trade the last few days with a solid profit. I'm hoping I get some real choppy markets so that I can test my new strategy. I talked about ETF arbitrage in one of my old blogs I no longer write in. I said that it was not worth the effort and that I didn't have the advanced software needed to make money at it. Well, these last few days I have been doing ETF arbitrage on my favorite sector; OIL. I've made movies, and you can see for your own eyes how well this strategy works, but in order for you to trade this way you have to use hotkeys and be prepared to react to an oppurtunity in no less then 2 seconds. My average trade is held probably 1-2 minutes.
Consider this. If you are following the leader stock and using it to trade the laggard stock to gain your profit, why not hedge your position with buying multiple laggard stocks instead of just one, that way your are diversified or "hedged" in the postition.
Consider this. If you are following the leader stock and using it to trade the laggard stock to gain your profit, why not hedge your position with buying multiple laggard stocks instead of just one, that way your are diversified or "hedged" in the postition.
Monday, 29 May 2006

MARKET ANALYSIS
When I look at the VIX, it makes me want to buy.

The Biotech is bouncing pretty good. It may be a good short setup, however this is contigent on DNA and AMGN.

Check out the NYSE A/D line. It looks like a 2B setup to me.

The Biotech is bouncing pretty good. It may be a good short setup, however this is contigent on DNA and AMGN.
Check out the NYSE A/D line. It looks like a 2B setup to me.
My plan-It's a work in process, this stuff takes time to learn
First, I will take a look at the futures premarket on tuesday. Then Depending on the opening price I will go long or short of one of the stocks I'm looking at. Also, I'll scan for news before the trade. The target will be small, but a small profit target has a higher probability of being hit, so doing many of these small trades should add up over time. Of course all it takes is one bad trade to wipe me out.
I think INTC and MSFT are going down even further. INTC to 15 and MSFT to 22. I was thinking of the Jan 07 puts on both. The ITM puts are best on both, 2 strikes ITM.
Overall, I don't think the market is going anywhere this summer for the tech sector, except down. Oil may rally higher. Natural gas I hear should go down. I think the metals may retrace, although it tends to move in the same direction as oil. The US dollar is very weak right now and is near its lows, if it rallies, the metals may be a good short. Also, we may have our usual hurricane season down in the gulf, which always helps the oil sector.
Interest rates should continue to rise, and the market should setup nicely for a bearish market this summer and maybe continue to the fall if the Fed thinks its neccesary to keep raising the rates. Considering inflation and the current status of American debt at all time highs, and the housing market declining, and oil going up, it is a good chance the market may turn bearish. WHAT's there to be BULLISH about, unless interest rates are lowered.
I can day trade OIH pretty well by watching breakouts on crude oil. OIH trades smoother then most of the individual oil stocks like BHI, HAL, and SLB, but these 3 main stocks are good to watch because they make up the weight of OIH.
So I want to trade OIH, scalp GOOG the first 2 hours, trade options with lots of time value left (3months to leap options), sell futures options that are close to expiring(vertical credit spreads) and trade volatile small caps based off of the trend and opening gaps.
Overall, I'm bearish on the market, but I will trade stocks long intraday and using options.
Sunday, 28 May 2006
Next weeks plan
I'm putting together a list of stocks that are very volatile and have large intraday ranges. I'm going to swing trade these stocks based on the current trend and other strategies using morning gaps and volume analysis, while also taking into account any news that may affect the stock. I like the biotech sector because it happens to be a class of stocks that react to news in an extreme fashion and can provide for the oppurtunity to make some quick cash, but also on the other hand, you can lose it just as fast.
I want to stay on the side of the trend. I'm less inclined to go short on the stock unless I see an oppurtunity based on a spike in volume or the sector it is in is tanking, or if it has met resistance and is near the top of its trading channel.
I want to stay on the side of the trend. I'm less inclined to go short on the stock unless I see an oppurtunity based on a spike in volume or the sector it is in is tanking, or if it has met resistance and is near the top of its trading channel.
Saturday, 27 May 2006
SPECIALIZATION,,,are you a specialist?
I need to specialize. Knowing broad trends and strategies in general is nice, but you need to specailize on the stock your going to trade. Knowing everything about the company you are trading and knowing exact support and resistance levels can give you the confidence to make the right trading decisions. I use to specialize in biotech stocks. That's how I first got into trading. I would study the OHLC for the day and look at the volume. I would determine if the spike up in the biotech was valid, and if not, I would apply my shorting strategy, which would most of the time be a swing trade. I would make 5% per trade. Swing trades give you more time for your target to be hit. Options with time are even better, especially when you use credit spreads.
If your going to day trade, focus on the first 2 hours. If you aren't consistently profitable during the first 2 hours, then obviously you shouldn't day trade at all.
I've noticed that when a tick trend line has formed and it is broken, this sets up for a good trade in the direction of the ticks. Also, you have to remember what way the market is going. If we just had a 400 point selloff and we had a good rebound day , that rebound may continue as long as the trend line hasn't been broken. Also, take note of where the ticks have been most the day and where the trin is headed.
What it all comes down to is support and resistance, or supply and demand. People say, I want to buy stock XYZ for $10. If stock XYZ goes to $12, people are less inclined to buy, buy supply increases. As stock XYZ goes to $8, more people want to buy but supply decreases. Most of the time you need a catalyst to move a stock past a resistance or support zone. This catalyst is most likely news related, but can also be based on technical analysis of where support and resistance sit and where the moving averages and major trend lines are directed.
Things to look at:
I'm thinking of a few things:
1.Analyze scalps made in only the first 2 hours of market open.
2.Analyze forex pairs.
3.Analyze earnings reports vs. stock reaction
4.Analyze high dividend stocks, with avg. worst max draw down in a years time.
5.Create option setups (selling calls/puts on futures, directional, vertical and calender spreads)
6.Create biotech watchlist, and swing trade news.
7.Analyze relationship between EURO and US stock market.
8.Create trading system with TS.
9.Put together list of the top 10 things you suck at when trading, and if you are good at anything, list those.
Things we need to bang into our heads:
1.When the market is up, don't short, go long.
2.Trade breakouts of support and resistance, and look for pullback for entry, also, see if having the market in the same direction of the breakout helps.
3.Trade in the direction of the slow moving average, and look for harami and trend continuation patterns.
Tuesday, 23 May 2006
May 23, stocks I'm watching
I'm watching the oil sec, because they tend to give a better trend for my trades, where as like yesterday, AAPL and GOOG were sideways and choppy.(I traded the dead zone yesterday from waking up late).
Also looking at the metals, because of the volatility.
Stocks:
OIH,CVX
TIE, ATI, NUE
and also HANS and GOOG for morning scalps (they're volatile)
I will check the premarket on the metals and oil, and look for news and trade setup after the open. I will be recording.
Also, a short on PVX at the open for an ex-dividend short scalp.
Monday, 22 May 2006
Goals
1.Continue practicing day trading using setups and money management.
2.Educate yourself further on finance(look into CTA, CFP, CFA)
3.Identify options trades and apply them in the simulator.(Put these in the journal)
2.Educate yourself further on finance(look into CTA, CFP, CFA)
3.Identify options trades and apply them in the simulator.(Put these in the journal)
Friday, 19 May 2006
Wait for pullback on trend line breaks
It is common to see a trend line break that makes a pullback, only to leave you shaking your head and wondering if you timed your trade right. First, make sure you are using volume charts that cancels out noise in the charts, then look for valid setups. These setups should be preferably placed in the same direction of the market.


Thursday, 18 May 2006
My bad trades that I learned from
Never trade options without a stop. Never buy options very close to expiration unless they are hedged.(just stay away from options near expiration until you get good at them). Have a trade setup that can be flexabile when trading options, by giving your self extra time(months out options), in case the trade doesn't go your way initially. Use strategies like collars, strangles, and vertical spreads when using options. Options shouldn't be traded like stocks. They should be given much more respect due too their volatility and value at risk.
Look for a trade setup with a large reward/risk value, on the weekly, daily, and intraday basis.
Be aware of breaking news, and protect yourself from catasrophic damage by having your stops placed incase something bad happens in the market.(or something good, if your on the short side)
Know why you placed a trade. You must give a valid reason for entering a trade, even though the market may be random. Obviously your reasons will be primarily technically based, but having some news is a real plus to buy or sell.
Know what sectors are leading the markets and what ones are lagging and determine which ones to be long/short.
Use indices and commodities as indicators when trading stocks.(for example, you'll want to watch the crude oil contract and the YM,NQ, when trading oil stock or the oil etf OIH.)
Tuesday, 16 May 2006
New ideas to try out next week
My plans for the future to progress my trading career:
1.Find the stocks you are going to trade for the day before market open.(In this case, I already have a dozen that I'm familiar with trading, and I'm hoping a couple of these stocks will present a trade setup)
2.Know what economic news is coming out in the morning that can affect the indices.(I check out www.deltat1.com for important economic news and check out the indices pivot points and analysis, and also check out yahoo finance news, and www.tradethenews.com, and also I have CNBC up, sometimes I have bloomberg running on my computer, but I have to shut it off before I start trading or else my computer gets too slow.
3.Wait for the market to react to whatever economic numbers come out and try to determine how the market is going to trade that day.(I watch the futures,NQ,ES, and YM)
4.Have all of your charts setup for the different time frames you are looking at setups on.(I have 2 charts per stock,sometimes 3, and also a T & S window up and running. One chart is a volume chart based off of so many of shares traded, like 50s traded per bar, I also have a 24 second chart with MA's used as paintbar indicators. Sometimes I have a 3 second chart up that I use with T&S for trade entries and exits, and this is primarily only used for market open for quick scalps.)
5.Check out trading in pairs, spread trading, and stock short term hedges. Basically, I'm looking for stocks that follow an index, like the 20 components of the SOX, and I'm looking to go long the best looking stock out of the 20 and short the worst looking of the 20. If TXN or INTC look like they are leading the SOX/SMH, then I would want to go long the slower of the 2 and short the faster moving leading stock.
More on this idea later.
Friday, 12 May 2006
THE LIST (OF STOCKS FOR SWING TRADES)
Long list: CMCSK, WCG
Weak longs:AOB,KNOL, GIGM,

Short list: STEM, GNTA
Weak shorts: THLD, ESCL

Weak longs:AOB,KNOL, GIGM,
Short list: STEM, GNTA
Weak shorts: THLD, ESCL
Thursday, 4 May 2006
Best time to trade for me is the market open, Scalping
I will start to analyze my trades when I have more time.
I already know I'm over trading and that I'm taking unneccesary risks on scalps without good setups for a potential runner.
As it is right now, I trade best when there is lots of volatility, during the market open, which allows me to scalp, and sometimes turn scalps into good runners.
During the afternoon I try to scalp, and I get screwed, because of lack of volume and volatility, and also lack of patience and discipline to trade the right setup for the right time period of the day.
I will do more analysis of what type of trading I will be looking to commit myself to during the different time periods of the day.
For example, I may only scalp my favorite basket stocks the first 2 hours of trading and then leave with a profit. If I were to stick around and keep trading I would want to switch my style to looking for stocks with strong trends or chart patterns which show a potential breakout from a consolidation period.
I also need to setup my charts for the different time periods of the day. For the market open, I think the 6 second and 1 min charts side by side work best.
After the first 2 hours of trading, I should switch to 1 min and 5 min charts and start looking for the best stocks to trade based on chart formations.
When I have time I will record with my camcorder everything that I am doing for the trading day to help me with the analysis. I might use the computer screen recorder as well, but that tends to slow down things, and may only be good for slow periods of trading on 5 min charts.
Tuesday, 2 May 2006
Trading enhancements and refinements
1.I would like to have my chart setup with crossover signals that will alert my with sounds, like when the CCI or one of the fast EMA's crosses one of the slower MA's.
2.I need to practice on charts on what the criteria is for entering a trade (what is the setup I'm using, what indicators and MA's and time of day and what are the indices and similiar stocks doing) and also a basis for a stop, which can be trailed up if my trade is profitable.
3. I need to analyze all my best and worst trades to determine the time of day I trade best in and the setups I do worst and best in. So far I'm profitable the first 2 hours of market open, but after that, I tend to get chopped up on taking bad trades, trades that don't really have a good setup, but were entered because I was bored and wanted some action, this of course is a terrible and a losing setup.
4. What scanners should I use to trade during the slow afternoons if any at all?
5. Should I devote a screen to www.tradethenews.com, or should I subscribe to the online radio?
6. I need to do analysis before the market open which will include major economic numbers, and news for the stocks I plan to trade. A also need to know the chart formations on the stocks and indices that I may be trading so I know whhere resistance and suport is and what chart formation and setup is occuring on the weekly and daily charts.
7. The most important thing I need to do, is practice my trade entries based on a set criteria using multiple time frame charts and remembering what the average daily range and remembering to use fibs and trendlines that can span back many days.
8. I need to go over each trade I made each day and how I could have made it better.
Sunday, 30 April 2006
James J. Cramer "Confessions of a Street Addict" book review
I'm reading his book "Confessions of a street addict" and I'm really enjoying it so far. I always wondered how hedge funds operated, and this gave me a better clue to how the "smart money" makes there moves.
Once I'm done reading this book, I think I'll give it a complete review. Busy comes to mind when I read what the job was like for Cramer running the hedge fund with his wife Karen, Jeff, and staff, with making calls to CEO's, other firms, analysts, brokers, and spending a ton in commission to keep good contacts for what the brokers were thinking of promoting. Once Karen left the fund, things didn't run as smoothly, because her trading skills really made the Fund the best it could be. Also, Cramer is truely addicted to the market, with the market always on his mind, even when his wife is giving birth and when his mother is dying.
Once I'm done reading this book, I think I'll give it a complete review. Busy comes to mind when I read what the job was like for Cramer running the hedge fund with his wife Karen, Jeff, and staff, with making calls to CEO's, other firms, analysts, brokers, and spending a ton in commission to keep good contacts for what the brokers were thinking of promoting. Once Karen left the fund, things didn't run as smoothly, because her trading skills really made the Fund the best it could be. Also, Cramer is truely addicted to the market, with the market always on his mind, even when his wife is giving birth and when his mother is dying.
Saturday, 29 April 2006

Potential Long Swings and other setups coming
Metal stocks kick ass right now, but will the trend change?

Volatile Metal stocks!

Silver pairs (I like TIE)

Volatile Metal stocks!
Silver pairs (I like TIE)
Friday, 28 April 2006
1month chart on Oil sector

I've been daytrading OIH and it seems like a very good vehicle to drive and pair with the major index and crude oil and XOM.
Trade setups based on type of trading day
You may want to switch styles of trading based on what type of trading day your going into. If it's friday, you can expect low volume, and you may have a better chance at trading short term trends on the 5min chart instead of taking scalping on 1 min charts.
Also, be aware of big pending news that could decrease volatility and volume like economic numbers and FOC interest rate announcements. Also be aware of big cap earnings annoucements like MSFT had today, losing 11%, down to $24.15, and trading over 500mil shares for the day with over 100mil during the premarket.
Also, be aware of big pending news that could decrease volatility and volume like economic numbers and FOC interest rate announcements. Also be aware of big cap earnings annoucements like MSFT had today, losing 11%, down to $24.15, and trading over 500mil shares for the day with over 100mil during the premarket.
Thursday, 27 April 2006
Trade setups with high probabilities
Every trade should have a setup for entry. What's the premise for entrance",,,just because the chart looks good? I don't think so! You have to be aware of a number of factor before pulling the trigger. I'm putting together trade setups which the have a high probability of winning on a specific time frame for an expected amount of profit using indicators like MA's, stochastics, CCI, momentum, Elliot wave, MACD, time and sales, volume, time of the day, pairing off other equities, indices, and futures, the tick/trin/put:call ratio, and also pending news for that equity or sector it lies in and the underlying trend and major news for the day.
