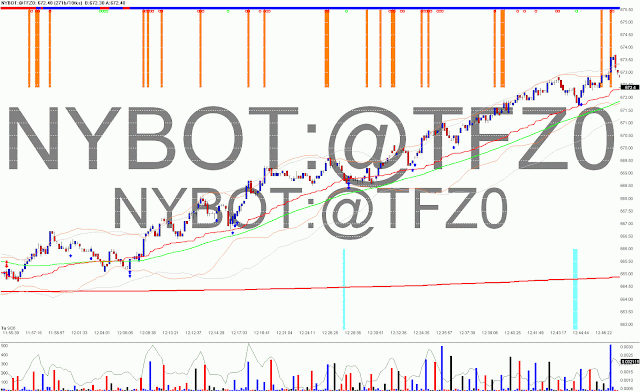
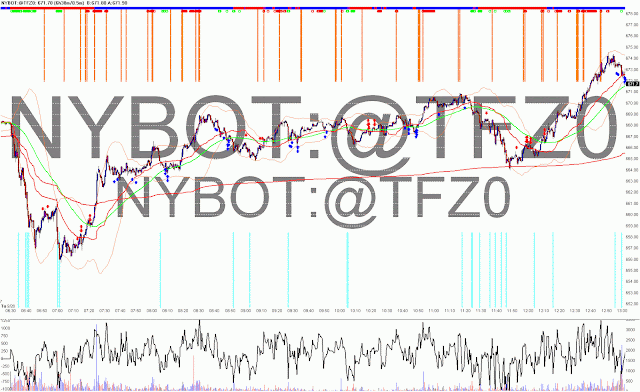
This video is comparing IB's data feed vs. Rithmic data feed from Optimus Futures brokerage. IB's data feed is down on ICE, and Rithmic is working as usual.
Wednesday, 29 September 2010
Interactive Brokers Data Feed vs. Optimus Futures Rithmic Data Feed Video
Labels:
BlowUp VIdeo,
Brokers,
interactive brokers,
Optimus Futures
Interactive Brokers Data Feed vs. Optimus Futures Rithmic Data Feed Video
This video is comparing IB's data feed vs. Rithmic data feed from Optimus Futures brokerage. IB's data feed is down on ICE, and Rithmic is working as usual.
Labels:
BlowUp VIdeo,
Brokers,
interactive brokers,
Optimus Futures
Tuesday, 28 September 2010
Saturday, 18 September 2010
Correlation Trader vs. Signal Trader
Crude Oil Correlation vs AUD/JPY & AUD/USD
Crude Oil Signals
Correlations only work until they don't. Friday, we saw Crude Oil get crushed. I made the mistake of basing my trades off the correlation of AUD/USD, AUD/JPY vs Crude Oil. This trade idea may work on a longer term basis(several Days), but I am a Day Trader, and I need to stick to what works for me, and right now, trading signals on a minute to minute basis and using stops has been working fabulously.
Labels:
AUD/JPY,
AUD/USD,
Correlation,
crude oil,
trade strategy
Thursday, 2 September 2010
Crude Oil Intermarket Correlation vs AUD.JPY & Intraday Trend Analysis
As you can see from the charts, Crude Oil and the AUD/JPY have been highly correlated as of late. We see Crude as a buy when it is oversold relative to AUD/JPY and Crude as a sell when overbought relative to AUD/JPY.
In this chart you can see how AUD/USD put in a higher low when AUD/JPY & Crude Oil were putting in a low for the day, suggesting a bullish divergence.
A common theme intraday for Crude Oil has been a second initiation in buying/selling in the direction of VWAP around 1 to 1:30pm EST, with a close near the low/high of day.(Please note my charts are Pacific time- Add 3hrs for EST)
Labels:
AUD/JPY,
crude oil,
intermarket relationship


