Tuesday, 30 January 2007
Jan 31 2007, Yikes,,what will happen?
I'm looking at the charts and all I see is a big mess with no direction. The indices have been chopping around in this channel for the last month. Tommorow is the day, at least I hope, that the market gives us a direction. I think I'm going to watch the market tommorow and record the action on my camtasia recorder. I suck at trading FOMC days, so I need to keep to my stops if I decide to enter on a trade. Also, I need to have my S/R zones in before tommorows trading and I need to pay attention to the tick and volume. I haven't got a chance to do any analysis yet on my tick/time/mp readings from last week, so maybe I can do that tonight or tommorow morning. I'll also need to be watchful of the 1-2-3 pattern tommorow after the FOMC minutes, if it happens I need to take the trade and look for profit targets around S/R zones or until volume and the tick tell me to exit.
Sunday, 28 January 2007
Jan 29 week outlook
I'm out of town Mon/Tues. I think the market is going to put in a direction this week and breakout of its range. The trend has been down, and the markets have been volatile lately. I've got a ton of analysis to do with not enough time to do it because I've been working 6 days a week on top of my morning trading. I need to stick to the correction position size for my account and trade my signals, it is simple as that.


Saturday, 27 January 2007
Trade analysis of my Worst day
Well, I didn't have any losing days all of January until Thursday. I was trying out a new strategy of scaling into trades, but I was on the wrong side of the trade. I lost about 4pts on ER2 with 2x as much size as I normally would when trading because I was trying out the new trading idea. Also, my stop placement was 4pts, instead of 1.4pts, which made things really bad. I have a lot of work to do this weekend on analyzing my trades, and I'm excited that I will make some progress in understanding things to become a better trader.


Friday, 26 January 2007
Jan 26 trade summary
Well, I held onto my short for the open and made back 1/3 of my loss from yesterday. ER2 had bullish divergence compared to ES all day. I only traded the morning, so I didn't see any of the afternoon rally in ER2. On Thursday I picked the wrong day to try out my new idea of scaling into trades.(I used buy stops to add to my long position only when the trade had moved into the black, however, the trend was against me, and I should have been adding to a short instead of a long). I've been using buy/sell stops, and they seem like they are not working for me. I normally use stops to exit my trades, but I'm getting better at just seeing the order flow and knowing when to cut the trade before the price travels to my stop. Also, scaling into trades hasn't been working either, I'm getting fills 0.2pts below my designated price, instead I should just enter the trade I want right then and stop using these types of orders. I think I need to be more aggresive in my trading in the morning and take the signals I get without hesitation. I think I'm going to use paintbar sound alerts to tell me when to enter trades so I become more systematic in my trades; moreover, this was my plan 2 weeks ago, however I haven't really been looking at the indicator at all. I'm mainly watching my ER2 tick chart, range chart with S/R lines and indicators, and NYSE and AMEX TICK. I think I need to start watching order flow for better timing my entries and exits.
Goals:
1.Setup paintbar indicator sound alert, enter on its signal.
2.Analyze AMEX/NYSE TICK, time periods, and MP levels
3.Analyze trades for better placement of scaling into/out of trades.
I feel like if I was trading stocks I wouldn't ever have big losses because the stops are easier to place without having to worry about noise like ER2 displays.
Note: The ES morning short trade worked just as I thought because there was no volume support underneath.
It looks like I'm tottally screwed
The market the last 2 days has wrecked havoc on my account. It doesn't even look like were going down today. We'll probably rally straight up, and then do the opposite the next day. My short on ER2 is 2pts further in the hole, I wanted to wait tell market open for this position to work out, but I'm getting the worst beat down ever and starting to stress out from having too large of size. I had 2 chances for an exit with a small loss, but instead I decided to give it time to work out. I was long at the close, but then I got stopped out 1pt away from the low, now I'm short and feeling pain. I should just close this position out and be done. How much more do you want to lose?
Thursday, 25 January 2007
Worst day YTD.
I traded against my signals and didn't do tick analysis. I didn't see today as being a bearish day. I'm short, and looking for er2 to drop to 779 tommorow, if we go below that the target is 772. ES and NQ are both setup to drop at the open tommorow. ES target for short is 1424. Overall I traded against my signals, traded too large of size, and didn't use good placement of stops. For some reason I wasn't as stressed as I normally would be when losing so much money. I'm going to have a tough time recovering from this loss.
Wednesday, 24 January 2007
Jan 24 trades
This morning I saw the long signal on NQ and got 4.25pts. I cut my profit short though. I need to improve my trading by letting my winners run forther. I plan on scaling into my breakout trades, and exiting half the position at my target and holding onto the other half until I see it's time to get out.
The research and analysis I'm doing with tick, time, and MP is helpful. What I need to look for is momentum shifting into low volume areas that are prime setups for breakouts. That is the trade setup that happened today in NQ.
I'm starting to right down my tick, time, and MP levels as they happen during the day, so it will help keep my focused and to make it easier for me to put in my journal later.

Tuesday, 23 January 2007
Jan 24th market outlook
SPY and oil are bullish, NQ and tech are bearish. Tommorow looks like it could be a big day, either bullish or bearish. We've got the oil # out at 7:30, which will be a big determining factor to see if shorts have to cover, or if the intermediate bearish trend continues. The charts look bullish as they stand right now, so I'll be on the lookout for breakouts to the upside with strong volume.


Oil update
As predicted, USO is bouncing, BP and APA are breaking out nicely. I wasn't sure which would be the better buy between BP and APA, but it seems best to take the most bullish stock between the 2.


Sunday, 21 January 2007
Things to do Jan 20
No trading on monday or tuesday for me next week because I have to work.
I plan on analyzing AMEX tick reversals at the values of -200, -100, and 200.
I also plan on looking at time periods 6:45-6:52am, 7:20-7:27am, 9:04-9:11am, and 11:56-12:03pm. I also need to do more research on Market profile.
I plan on analyzing AMEX tick reversals at the values of -200, -100, and 200.
I also plan on looking at time periods 6:45-6:52am, 7:20-7:27am, 9:04-9:11am, and 11:56-12:03pm. I also need to do more research on Market profile.
Saturday, 20 January 2007
Filtering for breakout setups
Here is a scan I'm working on for stocks to find consolidating high volume stocks set to breakout. I need to work on the filter some more, but this is a start- TradeIdeas
I need to specialize, so I will be focusing on the oil sector for some of my stock picks. I will also be looking at stocks consolidating near 52 week highs and lows as a start.
Here's a nice consolidation and breakout pattern seen in GROW.


Oil looks like it could bounce, APA is breaking out, and BP looks set to breakout with a nice bull flag pattern.
Thursday, 18 January 2007
Volume Gap+Momentum=Breakout
This is a volume report for ER2 with data from Jan 9th to the 17th. You can clearly see where the volume gap was and the trade setup that could've been taken.
One of my future projects is to look for stocks with volume gaps like this. There are many stocks with this type of setup everyday, providing high probability breakout trades.


One of my future projects is to look for stocks with volume gaps like this. There are many stocks with this type of setup everyday, providing high probability breakout trades.


Jan 18 trade summary
Well, I went short on ER2 before the big selloff this morning because I got the signal which accompanied my trading plan. My trailing stop was to close though, so I only got 3 pts on my trading plan, when I should have gotten 6pts. Today and yesterday I messed up on my placement of stops. I need to stick to 0.7-1.4pt stops, 3-6min time stops, stops signals from the appearence of divergences among the indices, or "the gut feeling" which I'm getting better at executing to minimize losses.


Wednesday, 17 January 2007
Trading Plan for Jan 18
My plan is the same setup as yesterday. Things could be ugly first thing in the morning, so I can't hesistate to take my signals if they occur.
Tuesday, 16 January 2007
Jan 17 trading plan
NQ lead the way up, and might lead the way down. I expect SMH and the tech sector to be bearish tommorow, so I think NQ will be bearish as well. I've got my MP levels setup, and the best trade setup is to the downside. I plan on going short if the previous days UVA is touched on ER2, or as soon as 792 is breached to the downside. My profit target is 783 to 780. There looks to be a gap between 791 to 783, which is 8pts to the downside. Also tommorow is the day before options expire, so things should be volatile one way right off the bat in the morning, and the current momentum as of yesterdays close was bearish. The tech sector and the indices on the daily charts all look awfully bearish.
Note: We have many Economic #'s out premarket, so there is potential for a gap and run if we trade into the breakout short area. If the #'s trade in my direction premarket, then I will try to get an entry. I really don't like taking trades premarket, but I'm going to take the risk if my setup occurs during this time period.


Note: We have many Economic #'s out premarket, so there is potential for a gap and run if we trade into the breakout short area. If the #'s trade in my direction premarket, then I will try to get an entry. I really don't like taking trades premarket, but I'm going to take the risk if my setup occurs during this time period.


Saturday, 13 January 2007
Market Profile Breakout Example
Here is a great picture and link on how to understand a breakout using market profile.

'Basic' strategy for breakout trades for tomorrow, using today's
(selected (5, 10 or 20 day)) Overlay:
-- Take a breakout long when price rises above upper limit
On the day of the breakout place a stop at the upper octant
-- Take a breakout short when price falls below lower limit
On the day of the breakout place a stop at the lower octant
-- For day trades: if not stopped out on day of entry, exit at the close
-- For swing trades on subsequent days: exit on a new bracket
keep stop at octant or move stop to last node as nodes develop
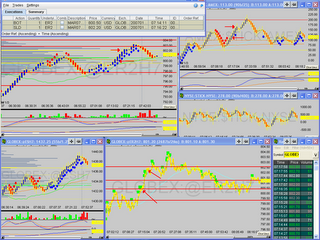
Breakout Trading on May 20, Using data of May 19 (See VG below)
The Visual Graphic of the T-bonds for May 19 showed balance on 20, 10
and 5 day Overlays. For T-bonds, we trade the 5 day Overlay: limits are
12020, upper and 11930, lower.
Price above 12020 (12021 or more) constitutes a "basic Value Based Power
Trading breakout". A basic stop for an upside breakout is at the Octant,
12018. Likewise, a downside breakout would occur at 11929 or less, with
a stop of 12000.
The Visual Graphic of May 20, below, shows a market that opened at 12016
and then moved up smartly to 12102, where it spent the rest of the day
congesting in the neighborhood of 12100. This is apparent from the
30 minute bars graphic on the upper right.


'Basic' strategy for breakout trades for tomorrow, using today's
(selected (5, 10 or 20 day)) Overlay:
-- Take a breakout long when price rises above upper limit
On the day of the breakout place a stop at the upper octant
-- Take a breakout short when price falls below lower limit
On the day of the breakout place a stop at the lower octant
-- For day trades: if not stopped out on day of entry, exit at the close
-- For swing trades on subsequent days: exit on a new bracket
keep stop at octant or move stop to last node as nodes develop
Breakout Trading on May 20, Using data of May 19 (See VG below)
The Visual Graphic of the T-bonds for May 19 showed balance on 20, 10
and 5 day Overlays. For T-bonds, we trade the 5 day Overlay: limits are
12020, upper and 11930, lower.
Price above 12020 (12021 or more) constitutes a "basic Value Based Power
Trading breakout". A basic stop for an upside breakout is at the Octant,
12018. Likewise, a downside breakout would occur at 11929 or less, with
a stop of 12000.
The Visual Graphic of May 20, below, shows a market that opened at 12016
and then moved up smartly to 12102, where it spent the rest of the day
congesting in the neighborhood of 12100. This is apparent from the
30 minute bars graphic on the upper right.
Market Profile Trends
I need to understand the past 3 days trend, the past 7 days trend, amd the last 3 weeks trend in order to be prepared for the next trading day.
Friday I should have been looking to take the LVA which came right around my prefered time of 10:30am. Why? The short term trend changed to bullish, so I should have been expecting another bullish day following a breakout day. That's what occured on friday, we had a bullish range setup in the morning, in which I didn't take part in because I quit early because the volume looked really weak for good trading. Next time I will need to take the short term trend into consideration for planing my trade for the next day.
Short term trend bullish = Buy LVA on range day
Short term trend Bearish = Sell UVA on range day
Short term trend consolidating = Look for breakouts
Friday, 12 January 2007
Jan 12 Trade summary
Today I waited for my setup to occur so that I could trade my plan.
The first 30min of trading was not very volatile and we had no breakouts.
The price was above the UVA after 30min of trading and there had been a lot of volume traded with relatively small movement in price. YM looked the weakest with the most overhead resistance, so I looked for a short on it when my signal occured.
Once YM gave the signal I shorted at 12572 with a 10pt stop and a profit target at 12556, ER2 gave a signal a little later and I took a short on it. I exited all of my trades with stops. I placed one of my ER2 stops to close and should have gotten a full pt instead of .3pts. My second scalp on ER2 was executed because I could tell that it was just a pop up to take out some stops before we went lower because the tick was still bearish and the pop was on small volume and no other indices were following. Unfortunately the stop was placed to close. Overall, I'm happy with my trades today because I waited for the setup and traded the signals. The market looks pretty dull today so I'm quiting after 45min and taking my profit.

Thursday, 11 January 2007
Things to do
1.Compare trading volume between futures and etf's. IWM's trading range and volume these last 2 days was almost identical. The weird thing is, today was a breakout day, and yesterday was a range day. I will post the numbers tommorow.
2.Start analyzing the first 15min and 30min of the trading day.
3.Study volume profile. Example-we breakout day 1, day 2 we trade down to the previous days LVA, do you buy, what tells you to buy, do you see heavy volume here, do you buy into weakness, or wait for a blue bar reversal? I will wait for green volume and a blue bar, because the market tends to penetrate the LVA and HVA a little bit to flush out stops, then it reverses. For example, the HVA may be 1332 on ES, but the price will go to 1334 with high volume and only for a short time period and then reverse back through the HVA of 1332 and back to the middle value area which is lower.
4.Tommorows plan- Only trade if you got your trend lines drawn in for targets. Only trade signals. Watch time frames. Keep stops. Cut the trade after 3-6min if it doesn't work,(still having trouble with time stops, but all trades should be green after 1min or else I didn't enter at the right time and there is a higher chance that the trade is going to be bad based on my my experiences)
Trade summary Jan 11 2007
My main goal everyday is to trade my setups the first 2 hours of market open and be done for the day. Today, I knew we were going to breakout, but I was unprepared for the type of scenario that the market played out. Although I had a positive P/L, I didn't take my signals and I ended up trading like a moron. I wanted to see a market low around the first 30-60min off of support from the previous day so that I could buy at these levels, but that didn't happen. Instead we ran up the first 30min, paused for a second, and then rallied for the next 60min. I was hesistant to go long on my signal because ER2 was already near volume resistance, and ES hadn't broke through 1327 resistance. Right after the 30min mark, ES broke and the market rallied. I knew that if ES broke through this area we would rally to but I had a conflict because I didn't know where ER2's next resistance point was, so I let the trade go, because I was unprepared. This type of trading day I've seen before, but I'm just now starting to recognize its pattern. The first 15min and 30min are the times I need to start analyzing more. When the market opens up, and at the 30min mark it hasn't made a lower price then the open, and we are above good support with resistance in the far distance, look to see what happens in the next 30min. I would bet a rally, especially after a 3-4 day period of consolidation. But what if the market was reversing and making a lower price for the day after the 30min mark? I would think more in favor of a range day, in which I would want to look to buy the previous days LVA and sell the previous days UVA. (LVA=low value area, UVA=Upper value area)
What do I do if i miss a breakout in the morning? look for the market to return to the middle value area for the day and be a buyer near this area. If it is a trending breakout day, the price shouldn't reatrace much lower than this area. On range days, look to sell the UVA, and buy the LVA. I have a lot more work to do on my research of market profile, volume profile, and the time periods in which to look for patterns in. I have much to learn about the markets and myself.
What do I do if i miss a breakout in the morning? look for the market to return to the middle value area for the day and be a buyer near this area. If it is a trending breakout day, the price shouldn't reatrace much lower than this area. On range days, look to sell the UVA, and buy the LVA. I have a lot more work to do on my research of market profile, volume profile, and the time periods in which to look for patterns in. I have much to learn about the markets and myself.
Hesitation at signals
You are a new driver and at a stop red light and the light turns green. Should I go? Is it safe? Do I need to look both ways first? HONK!!! HONK!!, Move it you idiot! The light is green!
It takes time to become confident without hesistation in taking your signals. A trader should trade without fear and take his signal without hesistation like he has done it a million times before and he knows what his possible outcomes of the trade are ahead of time. Two things can happen. PROFIT or LOSS. A smart trader puts in a logical stop that has a good risk to reward. And a good trader also has a profit target in site before he enters the trade.
Today I hesitated. Actually, I hesistated all this week on my signals. All of my signals this week would have been excellent trades too. What is happening right now is my brain is trying to learn to trust the system so that I have more confidence in my trades and to make the transition to trading its signals without hesitation or fear. The last 2 weeks it didn't given me a wrong signal. If I set up an automated account it would have kicked my butt this week. So my goal from here on out is to start trading it's signals without hesistation. Once I get a signal, I must be prepared before I can take the trade. The trade preperation required is to have a profit and stop target in site already drawn on my chart so that I can see where the near term support and resistance points are for my signal to travel to if it is correct. Next step is to make sure I have confluence from the other indices and TICK charts I'm watching. Next step is to pull the trigger. Before I even get the trade signal though, I should have planned out that day what I would do if I came to this type of scenario, so that I would be prepared for the signal, by having trend lines of support and resistance drawn on my chart. Also I need to be able to recognize what type of trading day we are going to have by the action in the first 30 minutes of trading so that I can be prepared to take a trade that is based off of either a range day or a breakout trending day. As always I need to trade with a stop and trade a position size that I am comfortable with losing several trades in a row on.
Wednesday, 10 January 2007


3pm reversals
Besides the 10:30 reversal period, which I see occuring more on range days, I also notice 3pm as a reversal period on trend days. My hypothesis is that automated trading programs close out positions at this time period when profitable and the price is below or above the VWAP.(many automated systems trade based on VWAP with exit points set at this time period)
What are other reasons for the 3pm reversal? Bonds closing.
Here is a great article from LBR on the subject: LBR article
Here is an example. The catalyst for the breakout was FOMC minutes.

What are other reasons for the 3pm reversal? Bonds closing.
Here is a great article from LBR on the subject: LBR article
Here is an example. The catalyst for the breakout was FOMC minutes.

Jan 10 trade

Well, this morning was pretty lame to trade, I got a couple signals on YM but didn't take them because the R/R didn't look good enough. I wanted to see ES break 1426, but we gapped down and we are no where near that number. NQ remains strong, and I should have been focusing on taking longs in it, instead of ER2 which has a lot of overhead resistance like ES.
Tuesday, 9 January 2007
Where we stand going into tommorow
To summarize it in a sentence, NQ look ready for a breakout and ES, YM, ER2, look like they are set to break through there overhead resistance trendline. If it doesn't happen tommorow, then things are going to look ugly for the bulls.


Jan 9 2007 trade
I wanted to be done trading after the first hour and a half. I missed the first sell signal,(still learning and watching my system), but I did take the next long reversal at 10:14am-10:20. After that trade I was done. My system signaled a short right around 10:44am, but I was done for the day. Today I set my target right at 781 which represented a high volume resistance area and a good profit target. I need to give the trade about a 0.7-1pt stop and give the trade 3-6min to turn profitable. I exited todays trade 6min after entry which is ideal.


10:30am Reversal Time
What makes 10:30 such a reliable reversal time?
Here's a revised excerpt from Elitetrader with my answer to the question.
I asked the same question to Dr. Steenbarger in his blog. He mentioned institutions finishing trading and locals entering trading.
My answer to the question is BREAK OUTS!
Instituitions are finishing up trading and the overseas markets are getting ready to close, so volume is declining. However if a significant S/R area is broken during this time period while institutions (volume) are in play, we have a higher chance of a trending day. If no breakout occurs during this time period, then we may see a range day.(No breakout= range day)
So when should we be aware of a possible breakout day? when economic #'s come out and during big news releases.
We can confirm the breakout if all indices are participating making new highs/lows.


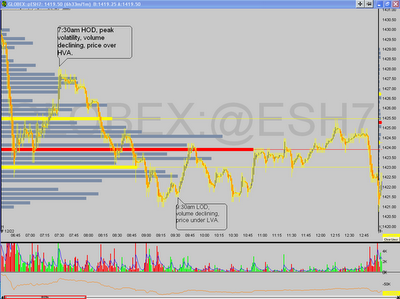
If you look at volume during these key times you can see a pattern. But why is volume always highest the first hour and why do we see a decrease in volume around this period often followed by a reversal? When this pattern occurs I notice a higher probability of the market staying in a range for the day that reverses around high and low value areas based on the daily/weekly high volume S/R areas.
There is also another common occurence. If there is a HOD or LOD that is established during the 10:30am time period, the reversal tends to last for a 1 hour or a 2 hour period on the dot. Institutions exit trading, locals enter trading, and program trading kicks in. My guess is that many automated trading programs are set to close trades after a 1 or 2 hour period if no new low or high is made after the reversal period. If no new highs or lows are made then we normally revert back to the highest value area for the day. (taking into consideration that around 50% of the volume these days is made by trading programs this may be a logical hypothesis for this common occurence)
An example of this occurence from the last 2 days:
Tuesday Jan 7 2007: reversal is at 10:40am, next reversal is at 12:40pm- 2 hours later on the dot, (note: 11:41 we broke lower, so the programs stayed short until 12:40pm)
Monday Jan 8 2007: reversal 10:14am, next reversal is at 12:14 am. (note 11:15am we broke higher, so the buy programs stayed on until the 2 hour reversal)
Here's a revised excerpt from Elitetrader with my answer to the question.
I asked the same question to Dr. Steenbarger in his blog. He mentioned institutions finishing trading and locals entering trading.
My answer to the question is BREAK OUTS!


Instituitions are finishing up trading and the overseas markets are getting ready to close, so volume is declining. However if a significant S/R area is broken during this time period while institutions (volume) are in play, we have a higher chance of a trending day. If no breakout occurs during this time period, then we may see a range day.(No breakout= range day)
So when should we be aware of a possible breakout day? when economic #'s come out and during big news releases.
We can confirm the breakout if all indices are participating making new highs/lows.


If you look at volume during these key times you can see a pattern. But why is volume always highest the first hour and why do we see a decrease in volume around this period often followed by a reversal? When this pattern occurs I notice a higher probability of the market staying in a range for the day that reverses around high and low value areas based on the daily/weekly high volume S/R areas.
There is also another common occurence. If there is a HOD or LOD that is established during the 10:30am time period, the reversal tends to last for a 1 hour or a 2 hour period on the dot. Institutions exit trading, locals enter trading, and program trading kicks in. My guess is that many automated trading programs are set to close trades after a 1 or 2 hour period if no new low or high is made after the reversal period. If no new highs or lows are made then we normally revert back to the highest value area for the day. (taking into consideration that around 50% of the volume these days is made by trading programs this may be a logical hypothesis for this common occurence)
An example of this occurence from the last 2 days:
Tuesday Jan 7 2007: reversal is at 10:40am, next reversal is at 12:40pm- 2 hours later on the dot, (note: 11:41 we broke lower, so the programs stayed short until 12:40pm)
Monday Jan 8 2007: reversal 10:14am, next reversal is at 12:14 am. (note 11:15am we broke higher, so the buy programs stayed on until the 2 hour reversal)
Monday, 8 January 2007
This week's goal
This week I'm pretty busy. I plan on finishing reading "trading in the zone" by Mark Douglas and then start reading Dr.Steenbargers new book "Enhancing Trader Performance".
-100 amex tick trend reversals
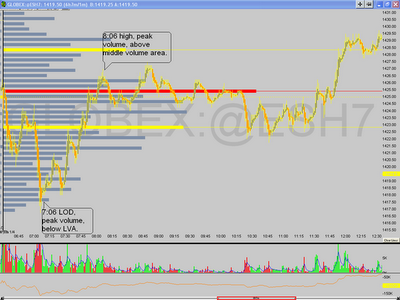
I mentioned in a previous post last week about the high probability trade setup of market reversals around the -100 amex tick reading, and today was the ideal setup, both in the time of day and the price level at which it occured based on volume profile analysis.
The reversal occured at 7:18am below the 70% volume profile level. After 2 hours we reversed again at 9:18am at the high volume profile area to return to the highest volume area of the day.Yesterdays lower volume profile extenstion at 781 acted as resistance today.
Overall my perfomance today was bad even though I had a positive P/L. Today I hesitated on taking my signals because I was watching my range NYSE TICK chart and only wanted to take a long entry off of a TICK pullback, which did occur, but I thought the NYSE TICK looked to high for an entry, so I kept watching and the price kept going up and I never got in the trade because I didn't want to chase it.
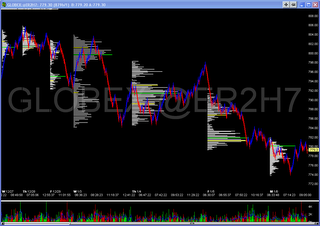
Checkout the Volume profile for the last week, you can clearly see the trend. I'll be watching for a possible reversal.
The reversal occured at 7:18am below the 70% volume profile level. After 2 hours we reversed again at 9:18am at the high volume profile area to return to the highest volume area of the day.Yesterdays lower volume profile extenstion at 781 acted as resistance today.

Overall my perfomance today was bad even though I had a positive P/L. Today I hesitated on taking my signals because I was watching my range NYSE TICK chart and only wanted to take a long entry off of a TICK pullback, which did occur, but I thought the NYSE TICK looked to high for an entry, so I kept watching and the price kept going up and I never got in the trade because I didn't want to chase it.

Checkout the Volume profile for the last week, you can clearly see the trend. I'll be watching for a possible reversal.
Friday, 5 January 2007
The ego and trader forums
I notice many people on Trading forums try to make market calls in real time only to be wrong, and they end up taking big losses. I did it in the past. I've made a ton of mistakes as a trader and I realize that it was because I didn't having a strategy and that I let emotions take over during the worst of times.
Posting realtime trades on a message board, you feel married to the position because your "ego" is on the line and you want others to see that you were right all along and you end up lowering your stop and taking a bigger loss then you would have if you didn't feel the extra pressure.
I stopped all chat rooms and forums while trading realtime. It's hard enough trading. I don't need to be making market calls and typing on a chat or forum to prove to others that I can trade, and I don't have time to be reading what others are typing during the first hour of trading when I'm watching for my setup to occur. What is the purpose of chat rooms then? So you can teach/learn from others?????
I don't think I've learned anything from others. Everything I've learned has been through trial and error. An expensive education, but you remember what you learned and have more confidence in your trades when you find your strategy.(if you find your strategy)
My strategy on scalping stocks is watching a whole sub sector of oil stocks with high correlation and looking for stop running away from the sectors trend and trading that stocks divergence back into the sectors true direction, and also watch QM / USO for breakouts that occur and enter into the oil stocks before others notice and react to the move in oil. I plan on testing a new strategy on stocks in the next month that focuses on NR5-NR7 stocks and looking for pattern breakouts that have a high probability of making a big move.
Wednesday, 3 January 2007
Time to Read
I'm going on a business trip and won't be back to trading until next week. I will get the chance to read some articles and review some of my charts.
I only had 1 trade today and then stopped with a postive P/L. Overall ER2 had a huge range today in which I wish I could have traded, but I had to leave early. Hopefully volatility keeps up, because it provides more opportunities.
I only had 1 trade today and then stopped with a postive P/L. Overall ER2 had a huge range today in which I wish I could have traded, but I had to leave early. Hopefully volatility keeps up, because it provides more opportunities.
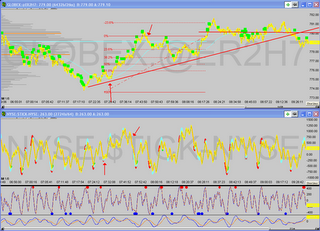
Jan 3 trade setup
6:30am- Morning gap, Plan, look for long setups, wait until after 6:50am before entering trade.
7am- long signal, also note, gap not filled and its been 30min, there is a high probability setup of a breakout to the upside when gap is not filled and price breaks through HOD before 8:30am.
7:13am- long signal on chart
7:14am- 2 block trades at high volume resistance area
7:14:11am- ENTER LONG 800.5 (0.7pt stop, 803.1 target)
7:16:22am- NYSE TICK high 1000+, block trades, tighten stop, STOPPED OUT 802.2.
7:24am- HOD 803.9
7:25am-Reversal, currently above high volume area for the day, and below last thursdays high volume resistance area.
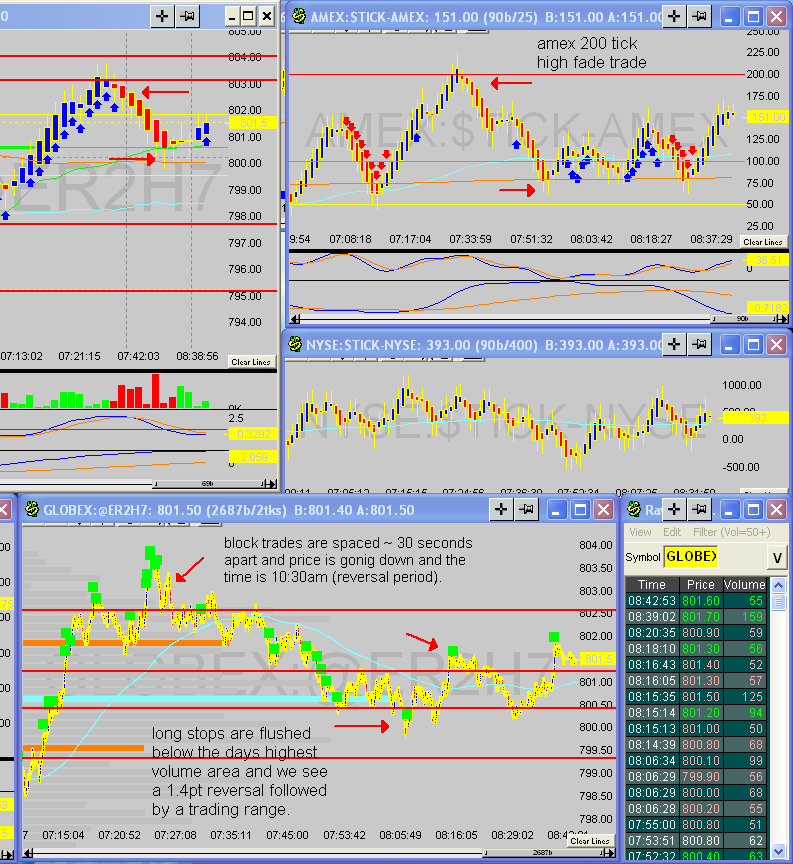
7:26am block trades are spaced ~30 seconds apart and price is going down and the time is around 10:30am (reversal period). And there is high volume of block trades placed above the high value area for the day, which is best for a responsive trade setup. Amex tick begins to reverse at key number of 200. NQ making new highs and ER2 not following. (Note-I've noticed a high probability of -100 amex reversals to the upside)
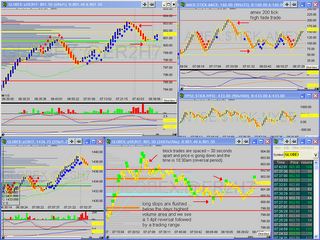
8:06am- long stops are flushed below the days highest volume area and we see a 1.4pt reversal followed by a trading range which will most likely continue until the release of FOMC minutes.

Note(my time on my charts are pacific, not eastern)
7am- long signal, also note, gap not filled and its been 30min, there is a high probability setup of a breakout to the upside when gap is not filled and price breaks through HOD before 8:30am.
7:13am- long signal on chart
7:14am- 2 block trades at high volume resistance area
7:14:11am- ENTER LONG 800.5 (0.7pt stop, 803.1 target)
7:16:22am- NYSE TICK high 1000+, block trades, tighten stop, STOPPED OUT 802.2.

7:24am- HOD 803.9
7:25am-Reversal, currently above high volume area for the day, and below last thursdays high volume resistance area.
7:26am block trades are spaced ~30 seconds apart and price is going down and the time is around 10:30am (reversal period). And there is high volume of block trades placed above the high value area for the day, which is best for a responsive trade setup. Amex tick begins to reverse at key number of 200. NQ making new highs and ER2 not following. (Note-I've noticed a high probability of -100 amex reversals to the upside)

8:06am- long stops are flushed below the days highest volume area and we see a 1.4pt reversal followed by a trading range which will most likely continue until the release of FOMC minutes.
Note(my time on my charts are pacific, not eastern)
Monday, 1 January 2007
My Trading Edge explained visually
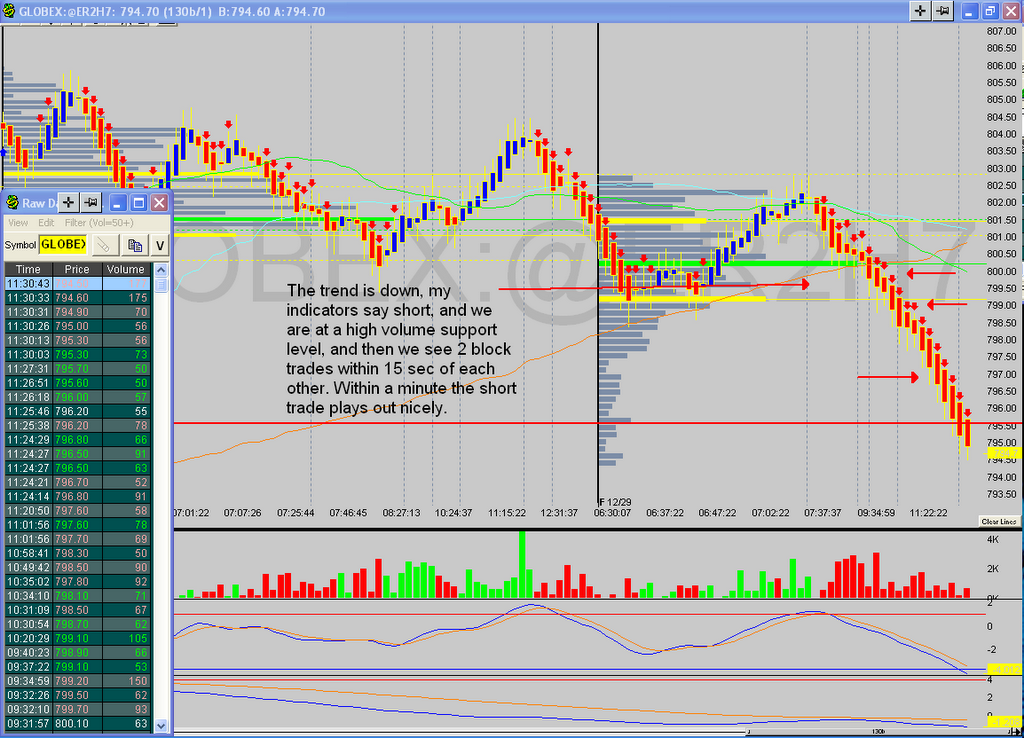
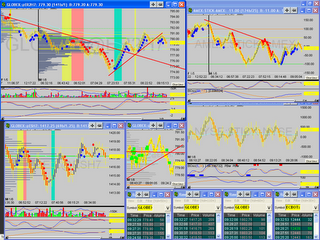
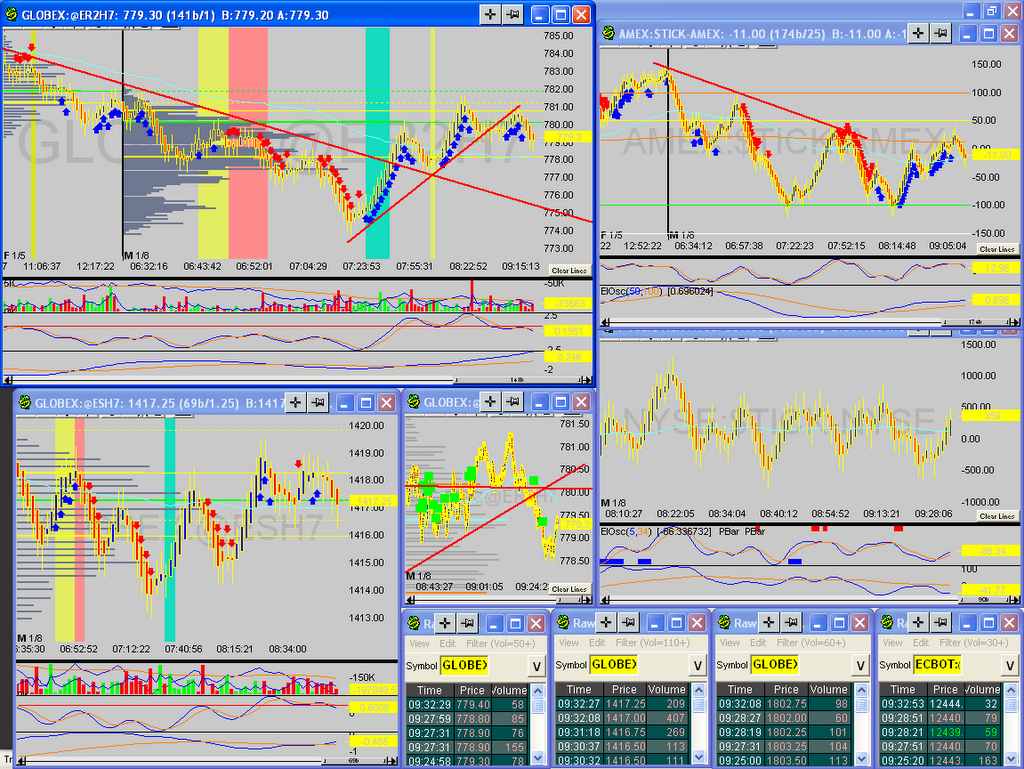
The plan is to wait for the setup. Once my indicators say long or short and I get 2 block trades on ER2 with 15seconds of each other in the direction of the trend, then I will enter with a 0.7 stop with an initial traget of 1.4pts. The amount of time given for the trade to work out is 3 minutes, and if I'm in the black at the 3min mark and my target hasn't been hit or the trade hasn't moved more than 0.5pts my direction, then I will set the trade to breakeven and give the trade more time to work out or stop me out at breakeven. The best setup for breakouts is when high volume at price (support/ resistance areas) are tested and we get block trades that act to penetrate the S/R areas. Here is a chart of the preffered trade setup combining my trading signals on my chart, T&S filter for block trades, and the chart showing volume at price support area being taken out.
Visual Differences between charts

I've looked at many different chart setups, and for my strategy on futures, range bars work best.
My futures strategy is almost in place I think. The strategy is based on finding S/R areas and looking for breakouts based on block trades. I will give the trade 3min to workout with a 0.70 stop on ER2.I find S/R areas by using volume at price analysis, similiar to market profile.
Here is a great article on market profile- SFO market profile article
I should be able to trade without a chart, and just use the tape. Volume and price tell all. I put very little value in time at price at all, and that is why I trade with range charts on futures now. It is of no coincidence that periods of low volume also show little price movement but often show long periods of time, which is of only benefit to option premium sellers.
Here is some volume analysis I stole:
Listen to What Volume Tells You!
There are 6 simple rules to learn in order to interpret price and volume movements:
1. Increasing volume on increasing price signals an acceleration in buying pressure and price advance.
2. Increasing volume on decreasing price signals an acceleration in selling pressure and price decrease.
3. Decreasing volume on increasing price indicates an easing in buying pressure and a leveling in price or price reversal.
4. Decreasing volume on decreasing price indicates an easing in selling pressure and a leveling in price or price reversal.
5. Higher than normal volume at price highs indicates selling into strength and a price ceiling.
6. Higher than normal volume at price lows indicates buying on weakness and price support.