7am- long signal, also note, gap not filled and its been 30min, there is a high probability setup of a breakout to the upside when gap is not filled and price breaks through HOD before 8:30am.
7:13am- long signal on chart
7:14am- 2 block trades at high volume resistance area
7:14:11am- ENTER LONG 800.5 (0.7pt stop, 803.1 target)
7:16:22am- NYSE TICK high 1000+, block trades, tighten stop, STOPPED OUT 802.2.
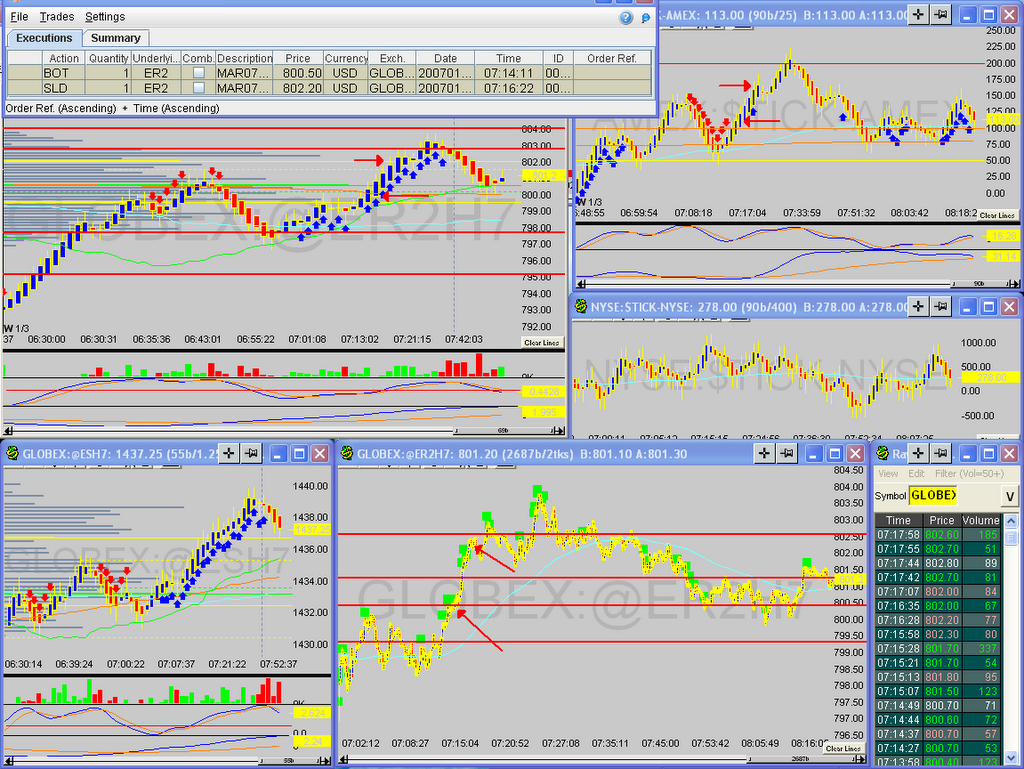
7:24am- HOD 803.9
7:25am-Reversal, currently above high volume area for the day, and below last thursdays high volume resistance area.
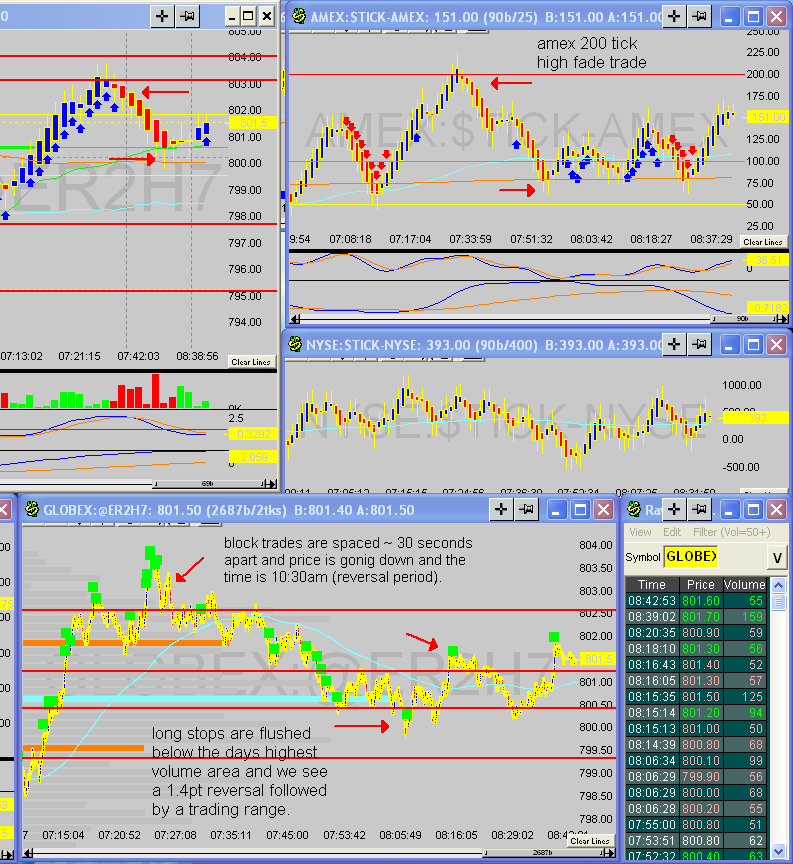
7:26am block trades are spaced ~30 seconds apart and price is going down and the time is around 10:30am (reversal period). And there is high volume of block trades placed above the high value area for the day, which is best for a responsive trade setup. Amex tick begins to reverse at key number of 200. NQ making new highs and ER2 not following. (Note-I've noticed a high probability of -100 amex reversals to the upside)
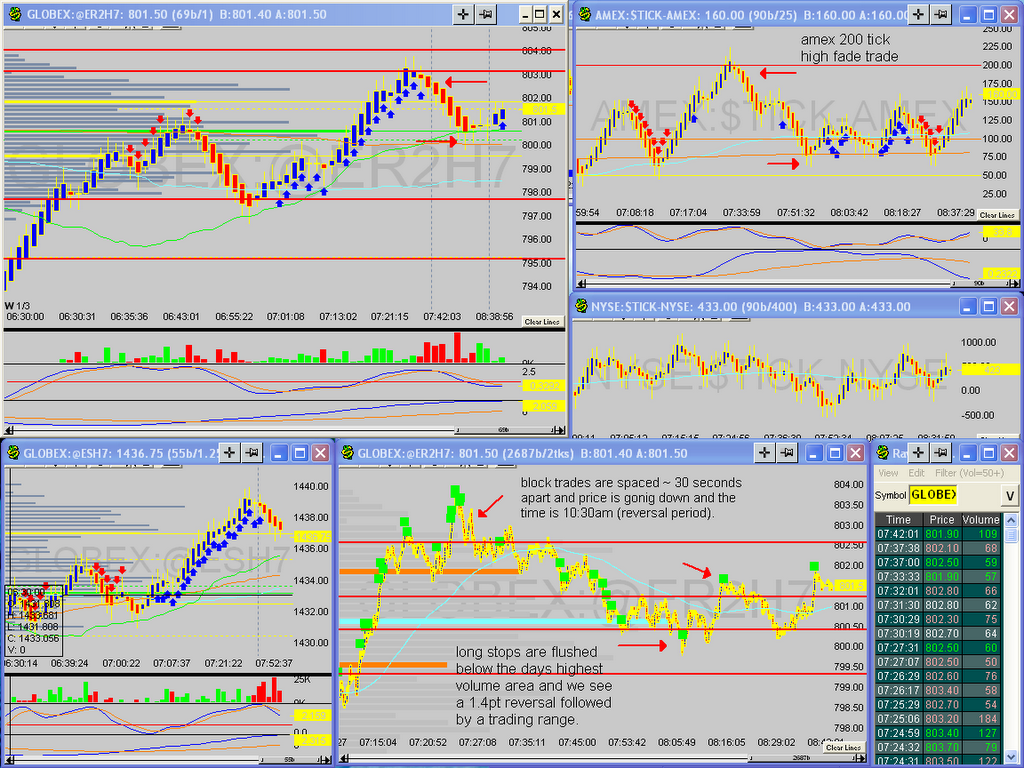
8:06am- long stops are flushed below the days highest volume area and we see a 1.4pt reversal followed by a trading range which will most likely continue until the release of FOMC minutes.
Note(my time on my charts are pacific, not eastern)
0 comments:
Post a Comment